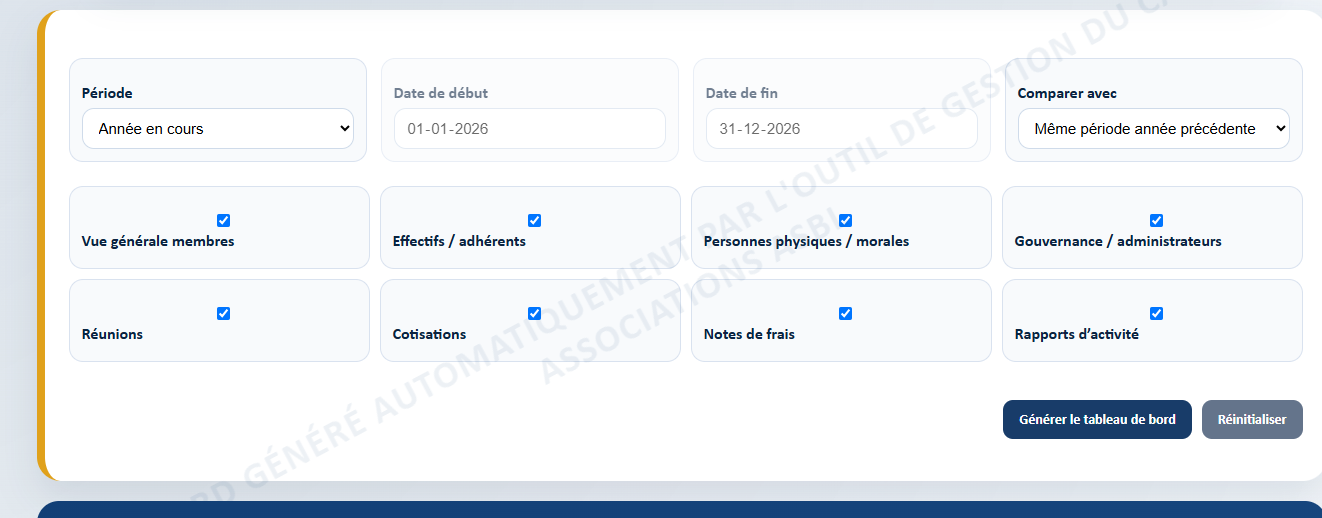
Choose Members indicators
Period, comparison and displayed sections can be selected before generation.
Milo by XMILO · Dashboards & management
Members, staff, clients, finance or building: Milo turns management data into directly usable dashboards, configurable by period and by the indicators you want to follow.
Not every manager needs the same information. Milo therefore lets you choose what to display, which period to analyse and, where relevant, what to compare it with. The result can then be viewed on screen or prepared as a PDF.
Configurable dashboards
A dashboard should not display indicators simply because they exist. Milo lets you select useful sections, choose a period and, where relevant, a comparison period. The generated view therefore matches the question the manager wants to examine.
Period, comparison and displayed sections can be selected before generation.
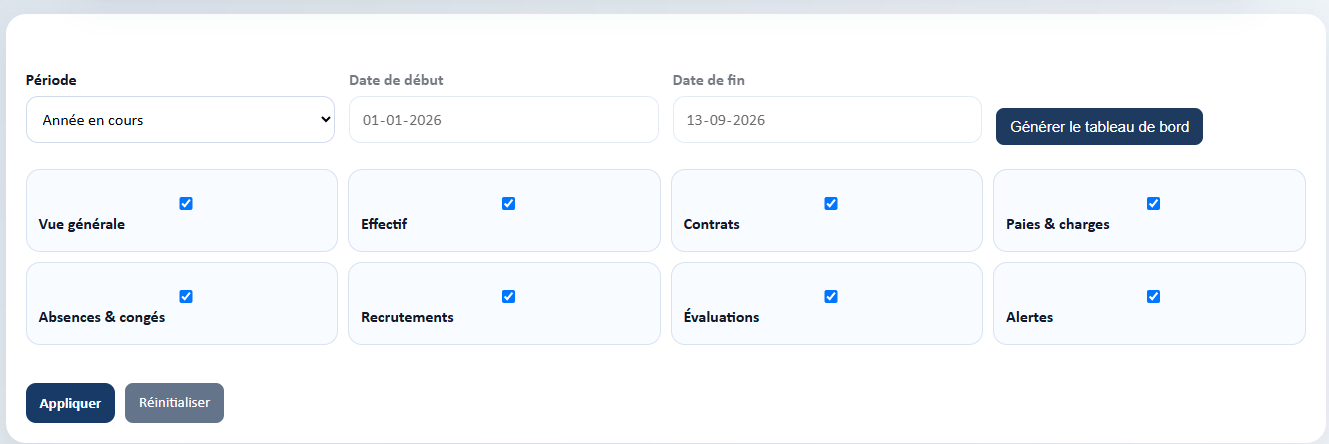
Workforce, contracts, payroll, absences, recruitment, evaluations and alerts can be shown or hidden.
Members & association life
Headcount, memberships, individuals or legal entities, administrators, meetings, fees, expense notes and activity reports can be brought together in one view. Managers can see trends without cross-checking several lists or exports.

Key Members indicators are brought together in one view.
Staff
Workforce, structure, contracts, payroll and charges, absences, leave, recruitment, evaluations and alerts can be analysed over a chosen period. The HR dashboard provides a concise view without replacing detailed staff records.
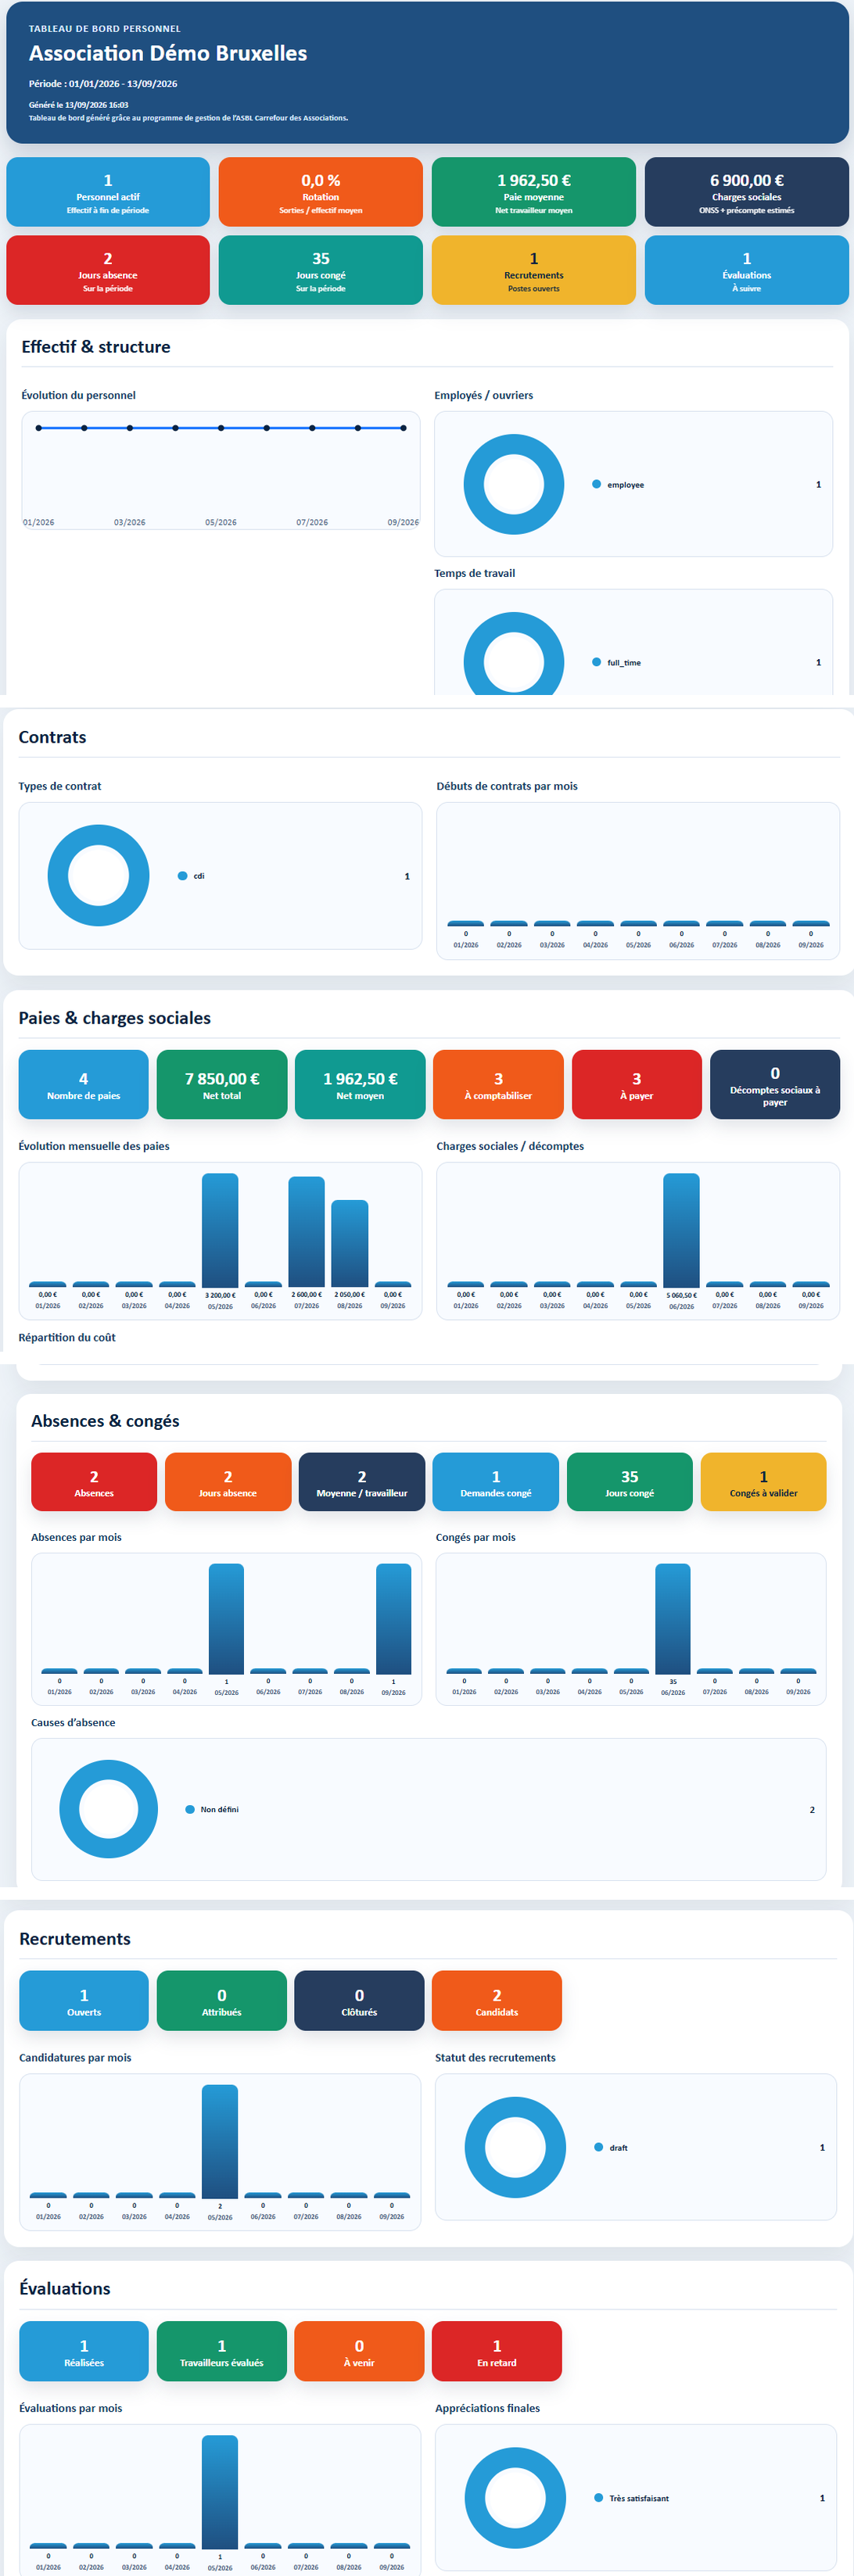
HR structure and activity figures become immediately readable.
Clients & activity
Quotes, invoices, credit notes, subsidies, public procurement and quote-to-invoice conversion can be followed in one dashboard. The goal is not only to know how much was billed, but to understand where activity stands.
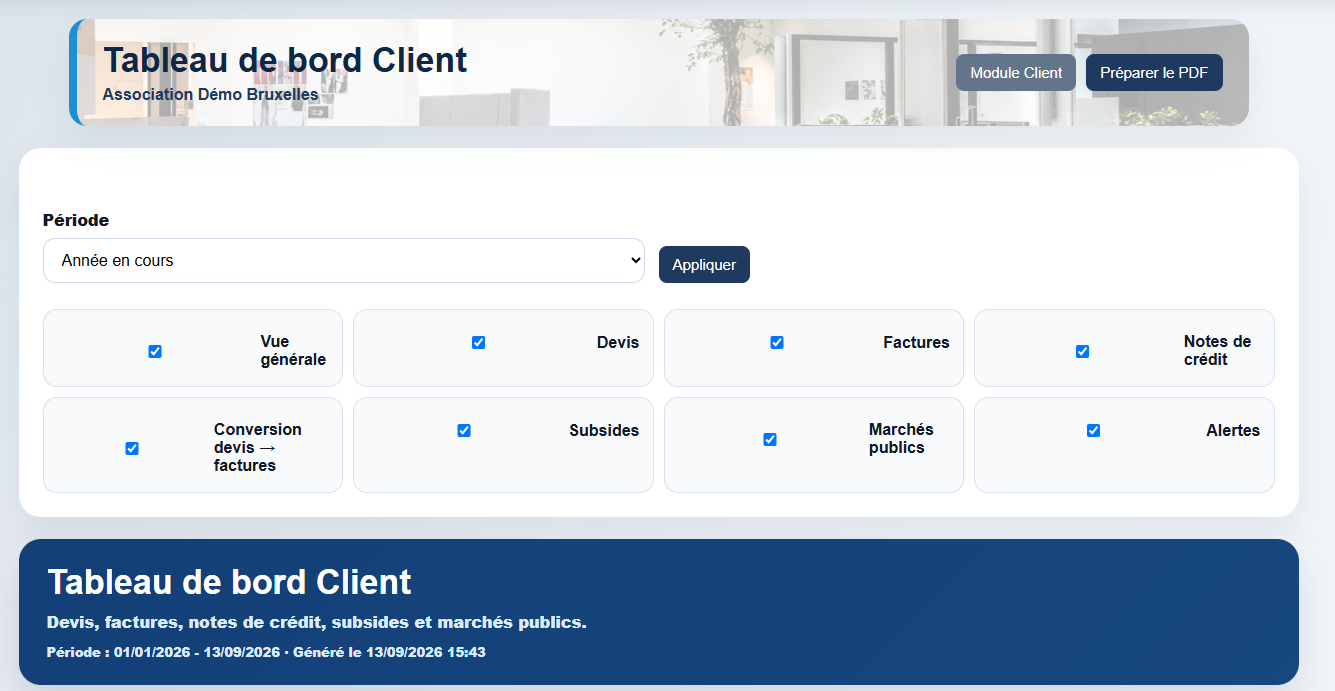
Sections can be enabled according to the type of monitoring needed.
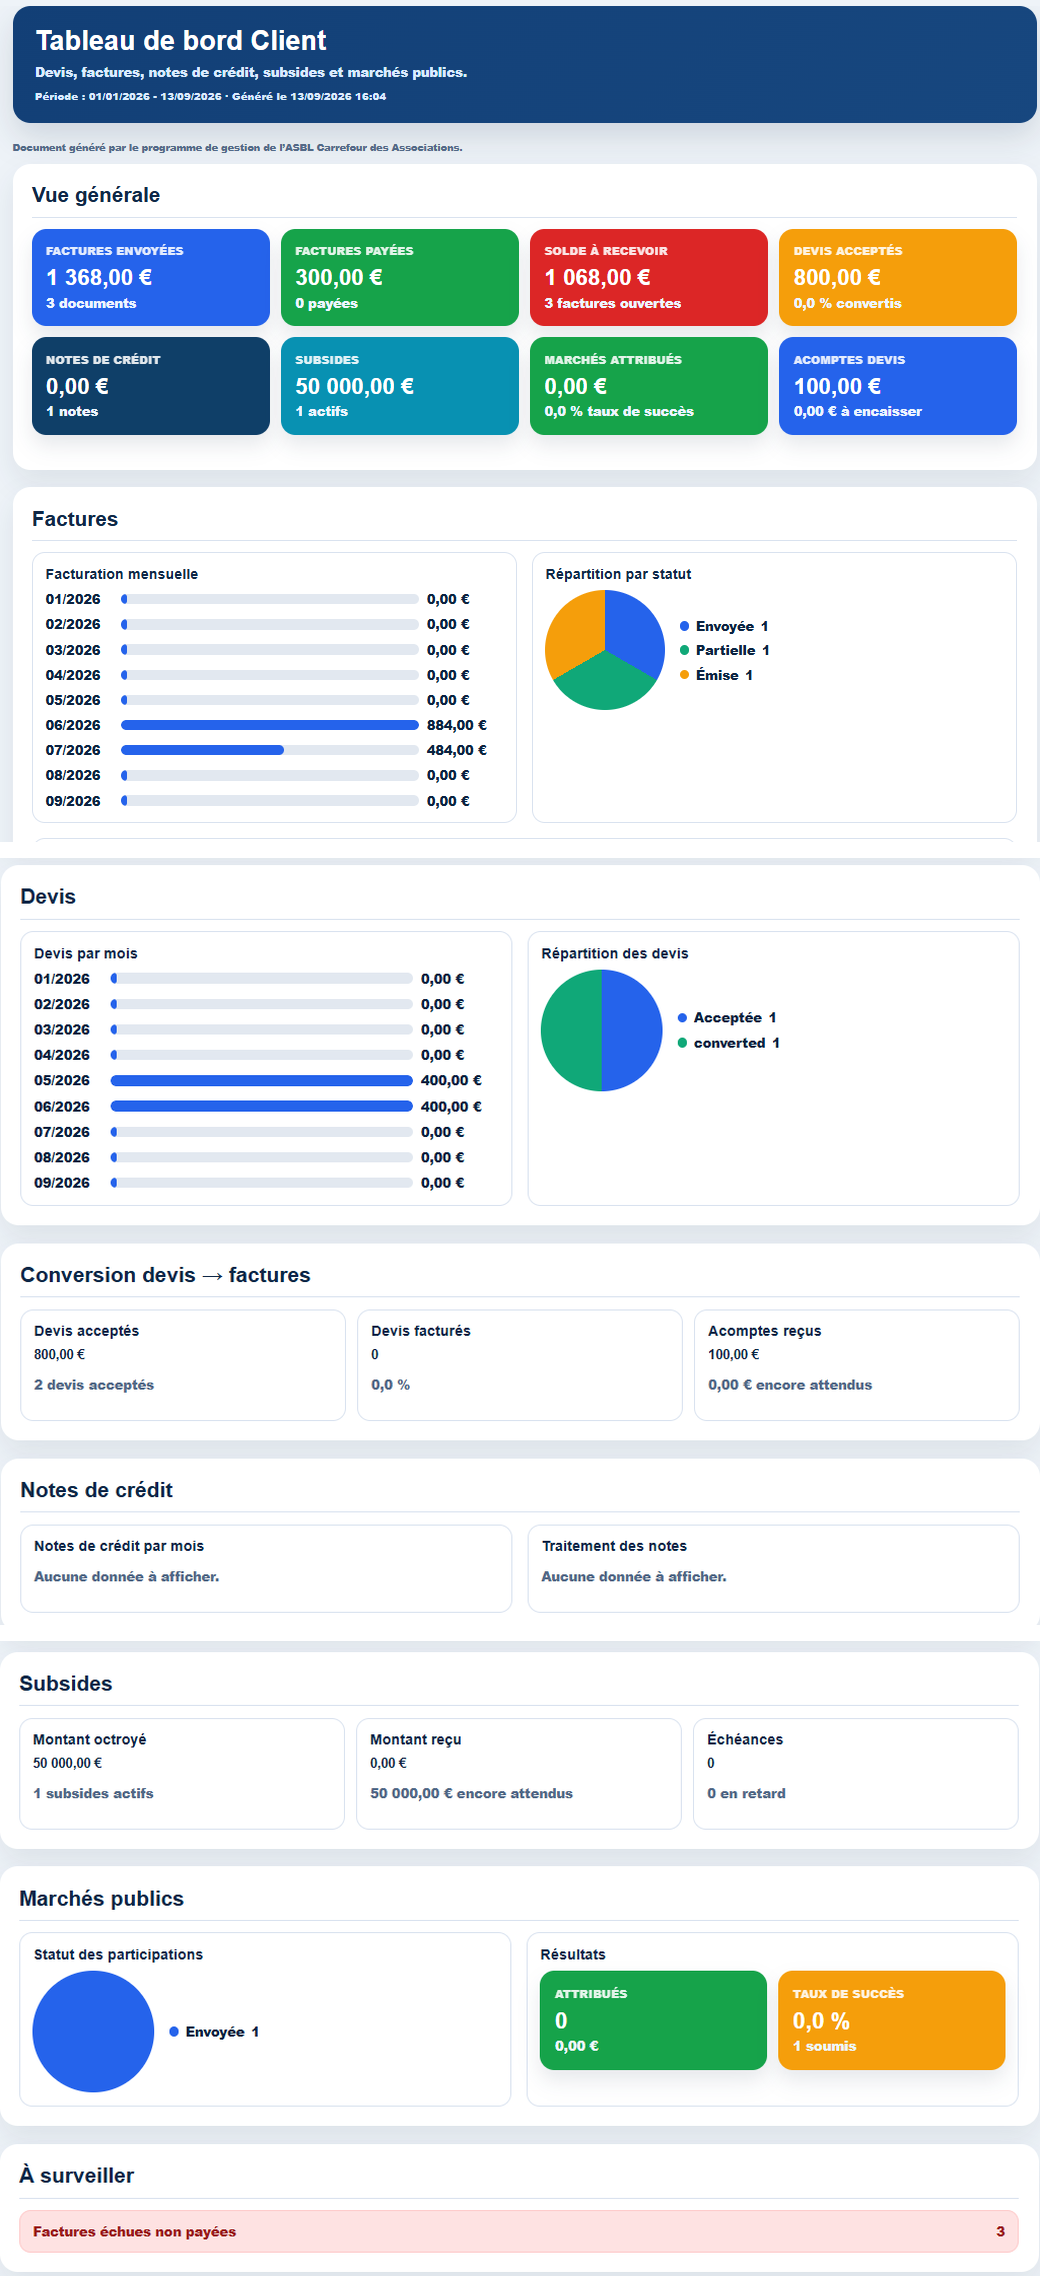
Billing, quotes, conversions, subsidies and public procurement are brought together.
Finance
Income, expenses, result, budget, cash position, banks, reconciliations, accounting status, loans, fixed assets, donations and tax certificates can be brought together in one view. Milo turns daily management into an immediately understandable financial picture.
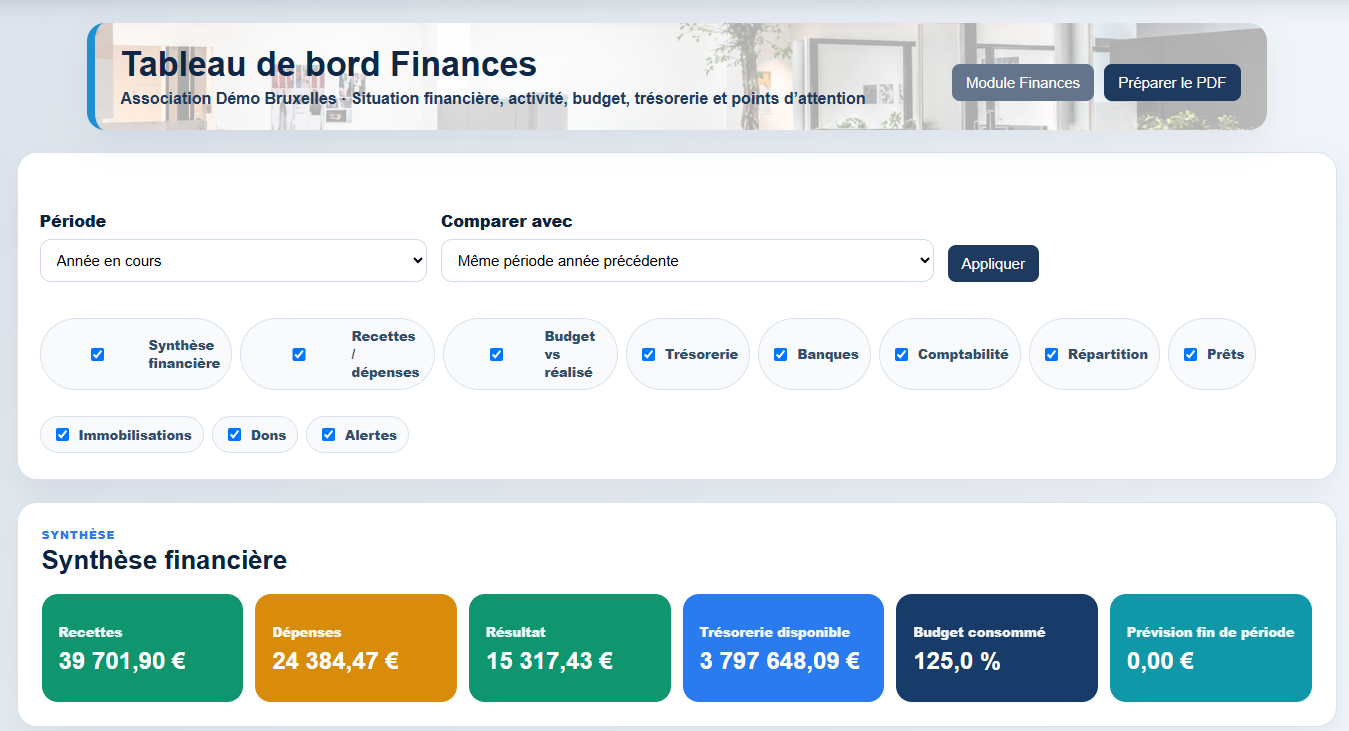
Financial sections and period comparison remain configurable.
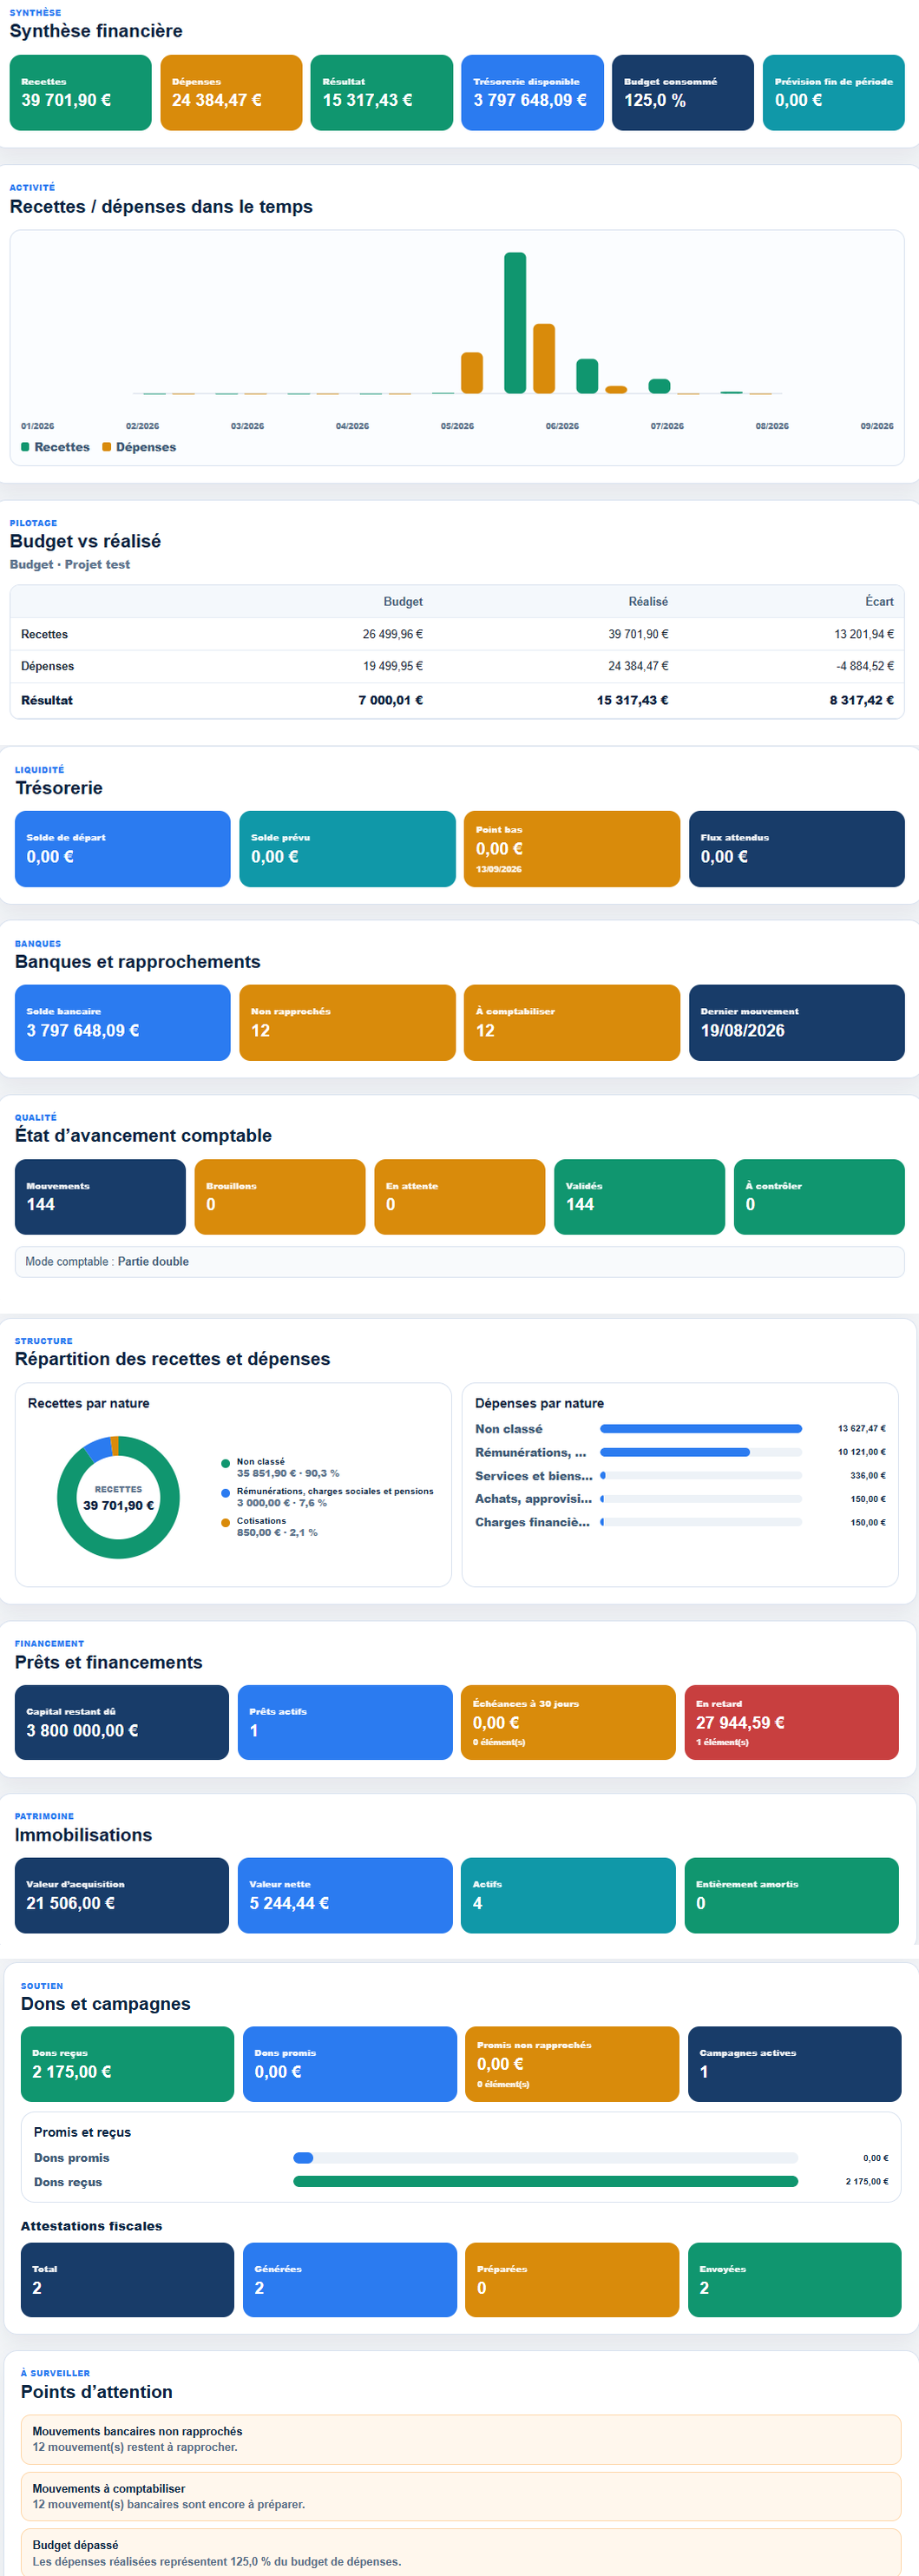
The financial summary makes balances, variances and points of attention easy to read.
Building & technical
Premises, equipment, incidents, maintenance, works, suppliers, costs, documents, plans and alerts can have their own dashboard. Technical managers get an operational view built from data already tracked in the Building module.
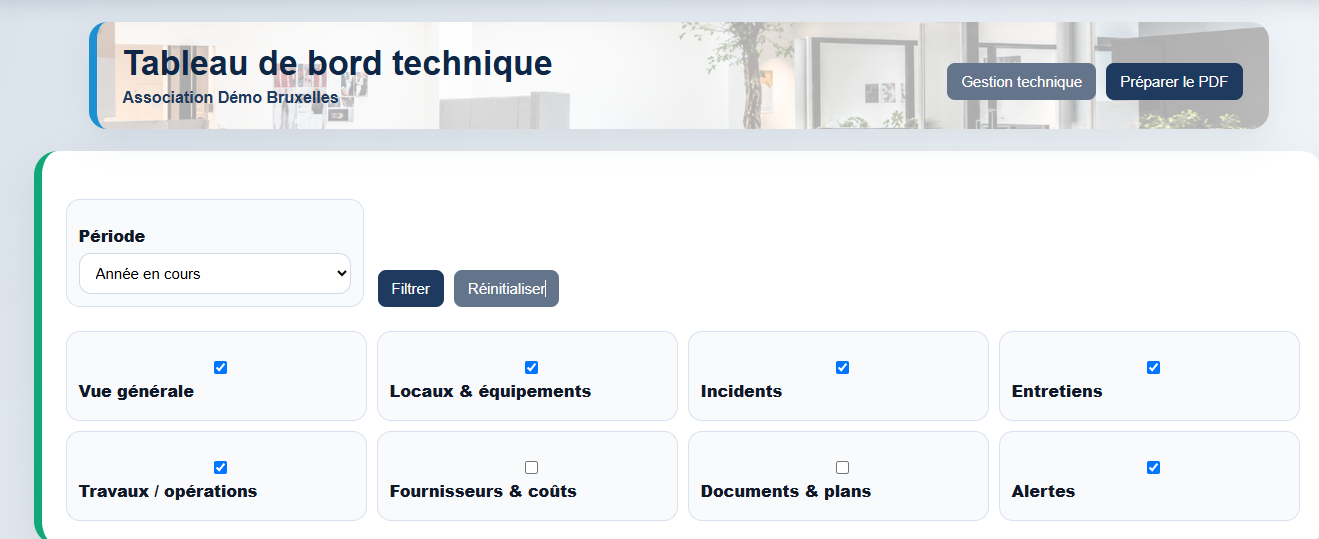
General view, premises, equipment, incidents, maintenance, works, costs or alerts can be selected.
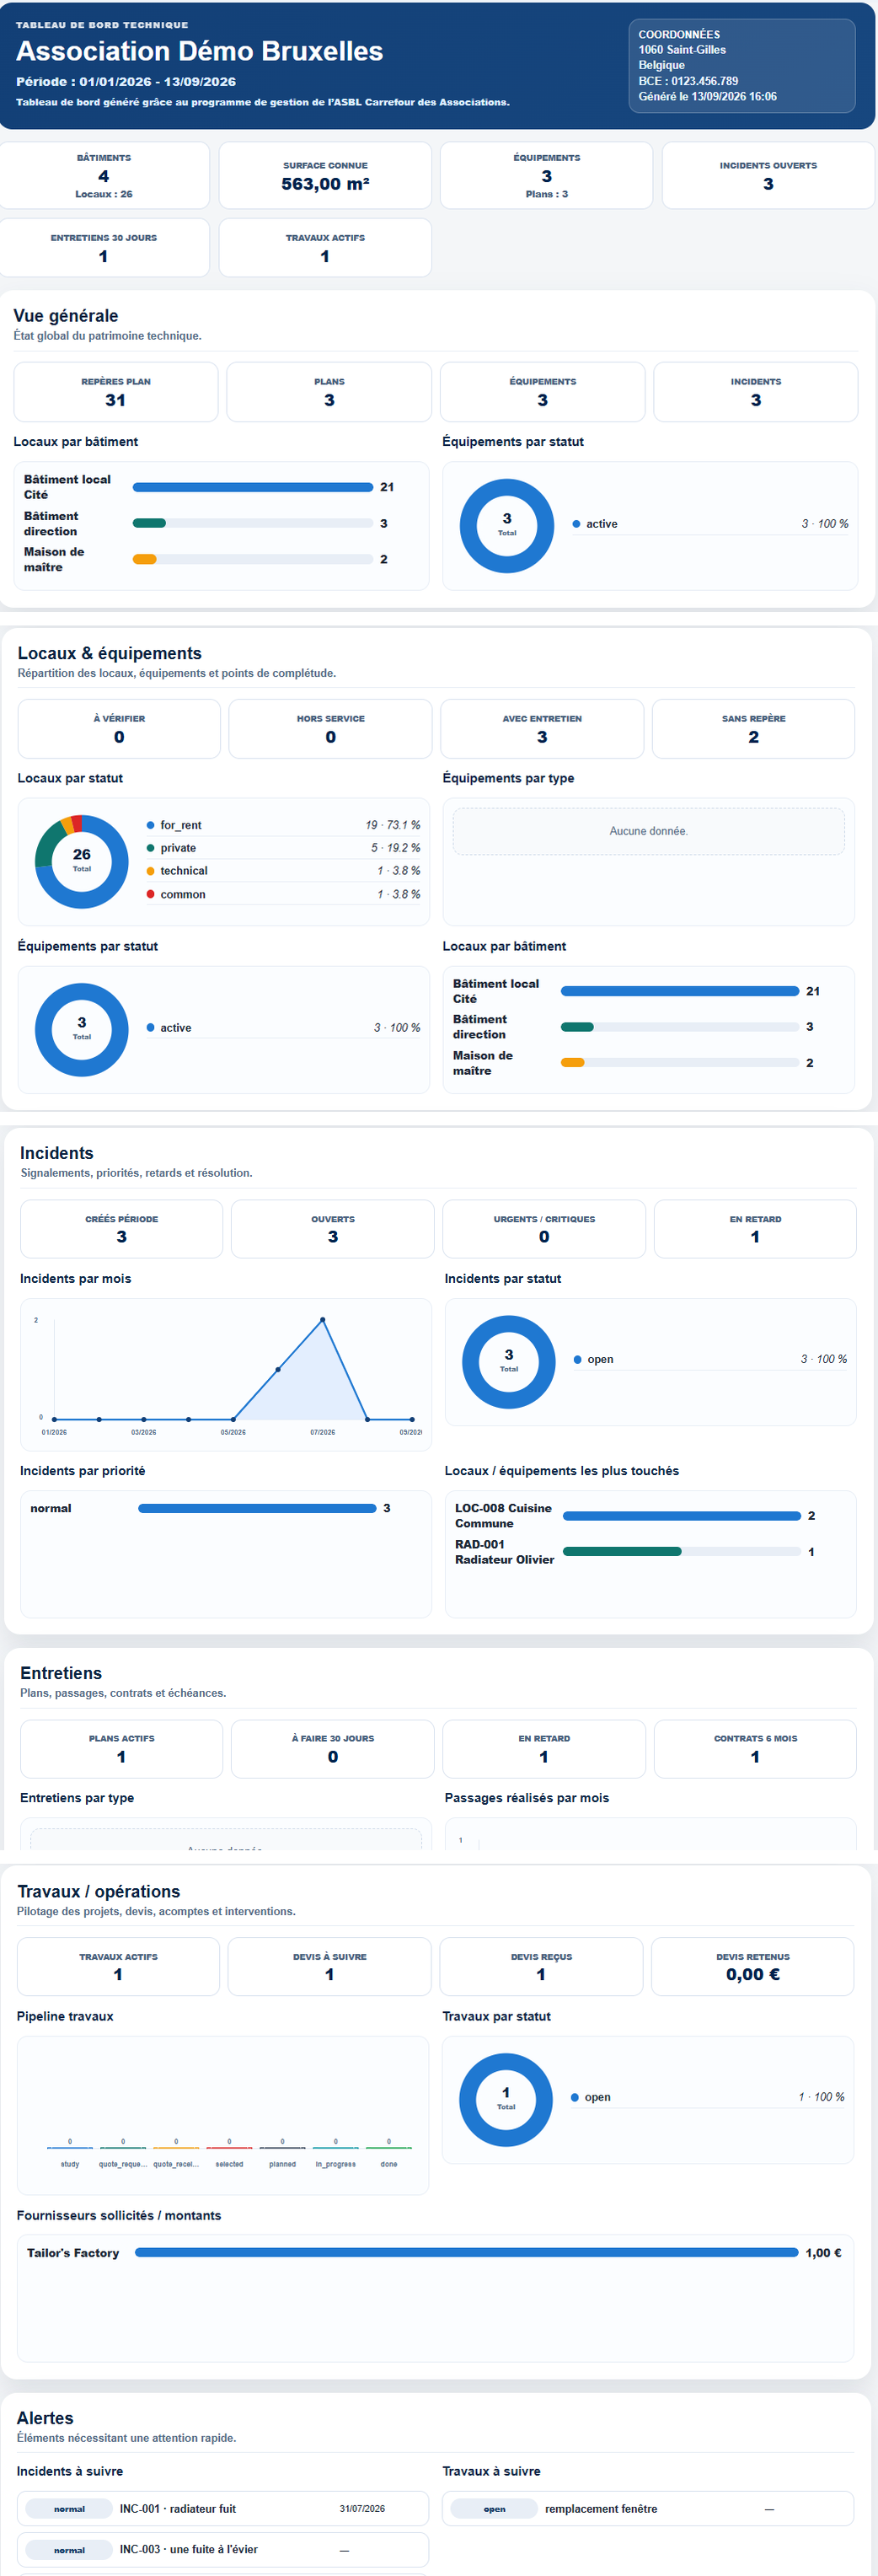
Technical indicators become readable in a single view.
One logic
Dashboards are not a parallel database. They use information already entered in Milo and present it in a form suited to decision-making. When data changes in the relevant module, the dashboard can be regenerated from the updated situation.
PDF & sharing
Dashboards can be prepared as PDFs for meetings, boards, general assemblies or internal monitoring. The same information can therefore support both daily management and communication with governing bodies.
Members, staff, clients, finance or building: each dashboard presents the data that actually matters to the manager, for the chosen period and with the indicators they want to follow. On screen or in PDF, reporting becomes a natural consequence of everyday management.